40% Hitting? 50% Pitching?
1. Introduction
Baseball is a complicated sport that consists of various external factors. Not only player skills but also other factors affect the ball game such as money, team chemistry, weather and so on (even luck as well). These external factors can be broken down as follows: (i) what we can measure and predict, and (ii) what we cannot. While we can easily measure player skills with the help of advanced sabermetrics, how would you measure (or predict) luck or team chemistry? Therefore, teams would definitely benefit from developing player skills rather than focusing on the unmeasurable. The player skills can further be broken down into four different areas: Hitting, Pitching, Fielding and Baserunning. In this column, I will statistically analyze how player skills affect a team’s winning percentage and provide readers with guidance on what aspects of player skills teams should focus on to win the ball game.
2. Methodology
To find accurate percentage contributions of those four aspects of player skills, I first selected a single team stat for each aspect. Although those aspects of player skills (i.e., hitting, pitching, fielding and baserunning) cannot be perfectly explained by any single stat, I decided to use one stat for each part of skills to avoid overestimation problems. For example, if we used OBP and OPS (or OBP and SLG) together as a representative of team’s hitting ability, then the importance of hitting ability would be overvalued because doubles, triples, and home runs are counted in both stats. The stat selection criteria are the following: (i) what’s the primary job of players in terms of those four different aspects? (ii) how well does each stat reflect (measure) those primary jobs? Based on these two criteria, I’ve obtained team wOBA for hitting, FIP for pitching, Def for fielding and BsR for baserunning data from FanGraphs.com. More details on feature selection:
3. Analysis
Since 1871, many external factors (e.g changes in rules and resilience of the ball, league expansion, advances in physical abilities etc.) have affected the way games are played. Therefore, those four league average stats would’ve fluctuated throughout the MLB history reflecting those external factors.
Likewise, looking at historical changes in each stat would also give us some general ideas about what the important factors were in different eras. To see those changes, I created two time series plots. (Note: I used median values of each stat instead of mean values to avoid outlier issues. Also, I used scaled data to directly compare different stats)
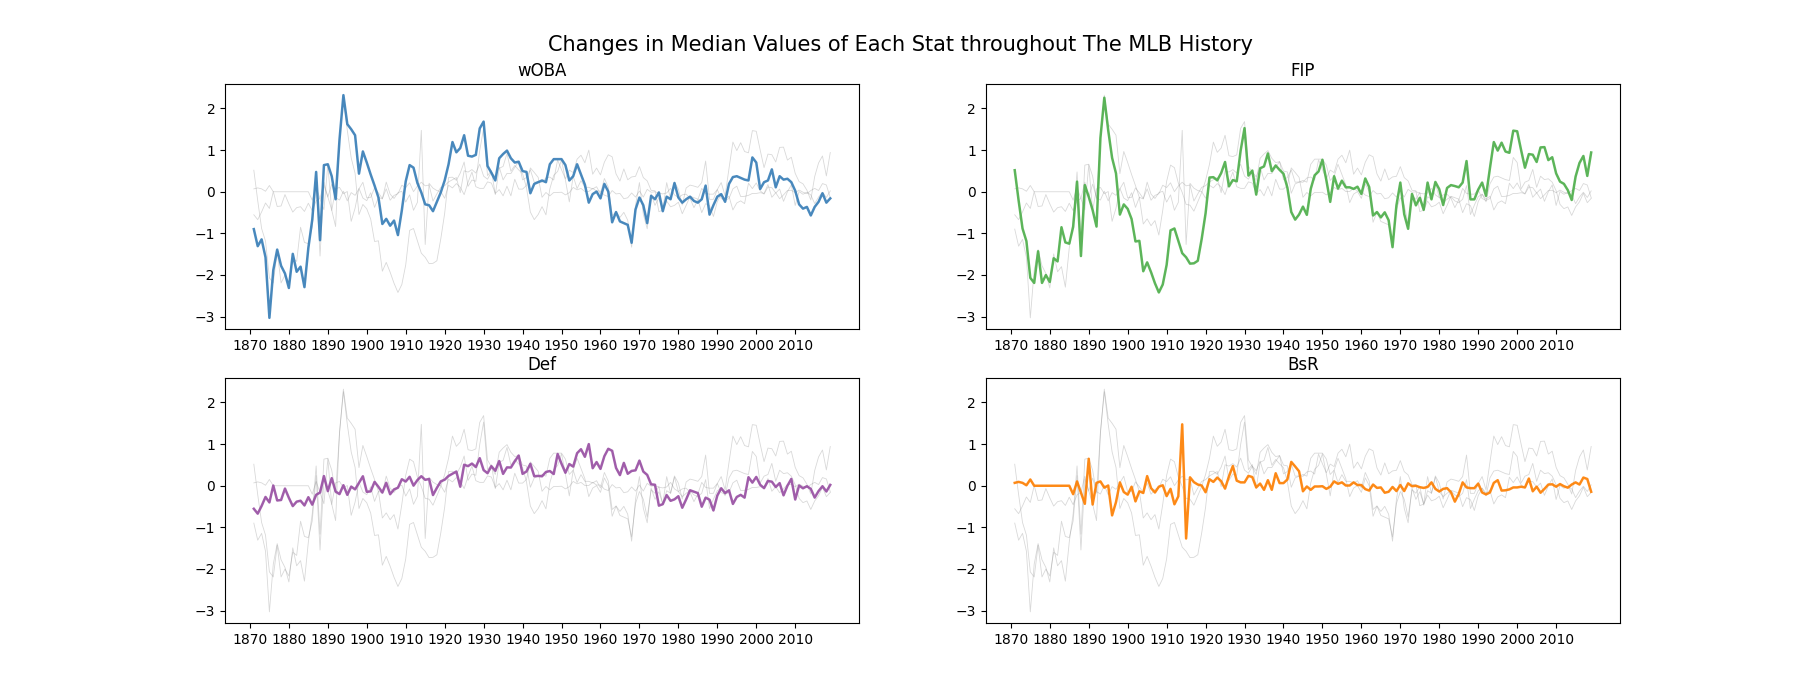 According to the time series plots above, while Def and BsR have been staying constant over time, wOBA and FIP are relatively more fluctuating from season to season. It might indicate that the importance of a team’s hitting and pitching ability has been changing since 1871, while fielding and baserunning almost constantly contributed to a team’s winning percentage.
Another pattern we can see from this plot is that when league wOBA was relatively high (i.e., hitter-friendly eras), league FIP also got higher indicating that pitchers struggled with doing their jobs during the same eras, and vice versa.
Furthermore, I also created year bins that represent different eras (e.g 1871-1899, 1900-1919 and so on) and drew another line plot to find a more general trend in how those league average stats have changed over time.
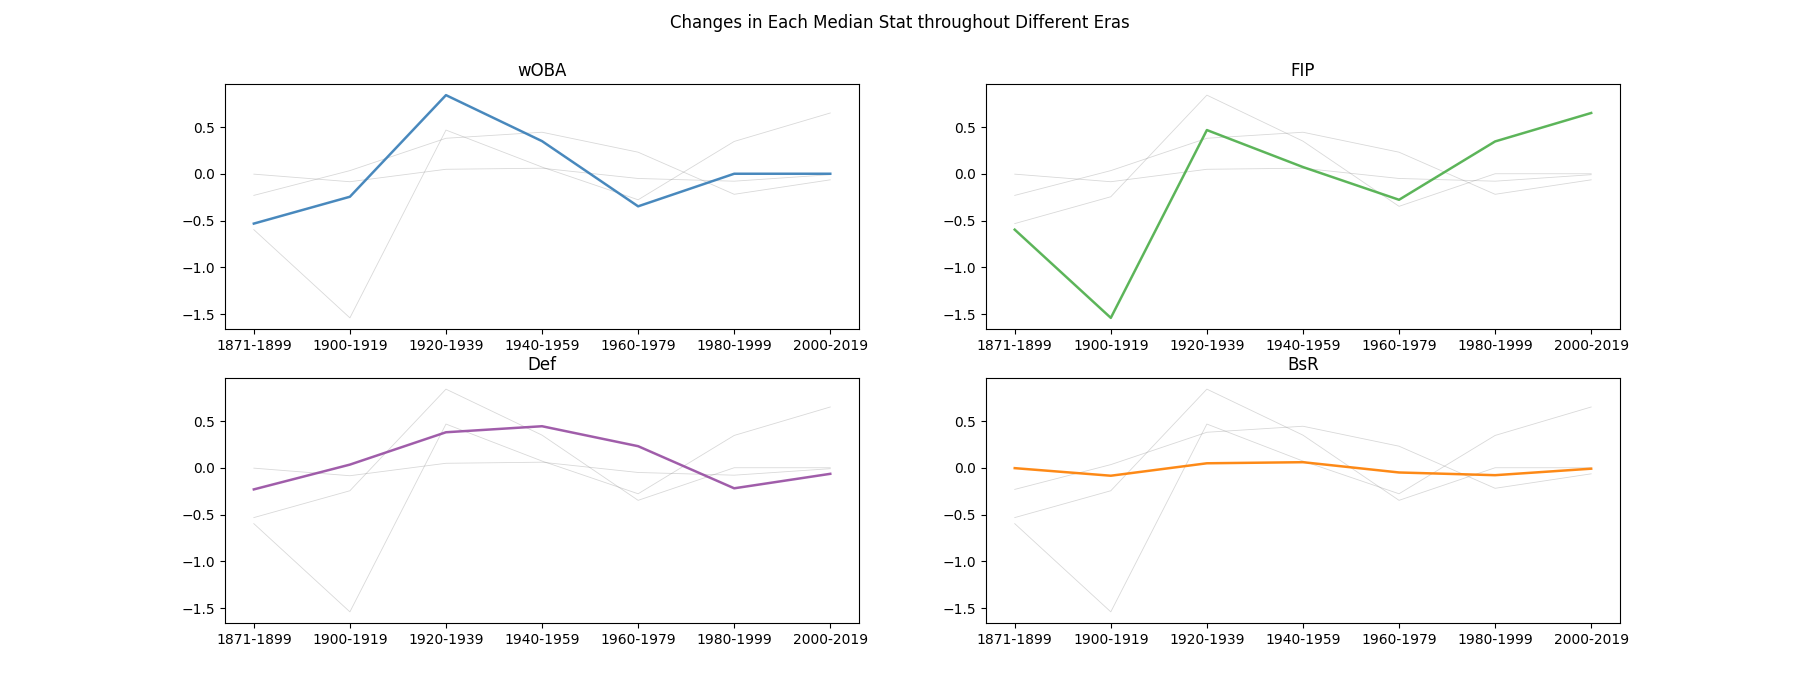 According to the second line plots above, we can see a clearer trend. For instance, when the resilience of the ball increased in 1920 (the lively ball era), both league wOBA and FIP skyrocketed during the 1920-1939 era compared to the dead ball era (Baseball-Reference, 2006).
Hence, we can assume that the importance of each aspect of player skills has been affected by other external factors such as pitcher-friendly rule changes or increases in the resilience of the ball.
On the other hand, I also compared how these stats differ on average depending on team winning percentages. To do so, I created a binary feature that represents whether a team’s winning percentage is above 0.500 or below 0.500.
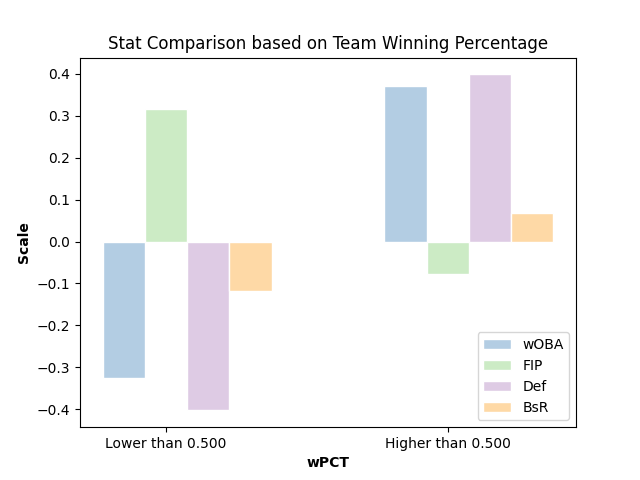 The bar plot above depicts that there are notable differences in average stats between these two groups. While the differences in wOBA and Def are relatively larger, the difference in FIP is not as significant as wOBA and Def. However, the difference in BsR is marginal compared to other three stats.
Thus, it appears that hitting and fielding might have more significant impacts on a team's winning percentage than pitching, while baserunning might not be that important.
However, it is not enough to conclude that how well each part of player skills contributes to a team’s winning percentage. Thus, I ran a random forest regression model for each era and compared impurity-based feature importance. The changes in feature importance in each era is shown in the horizontal bar chart below.
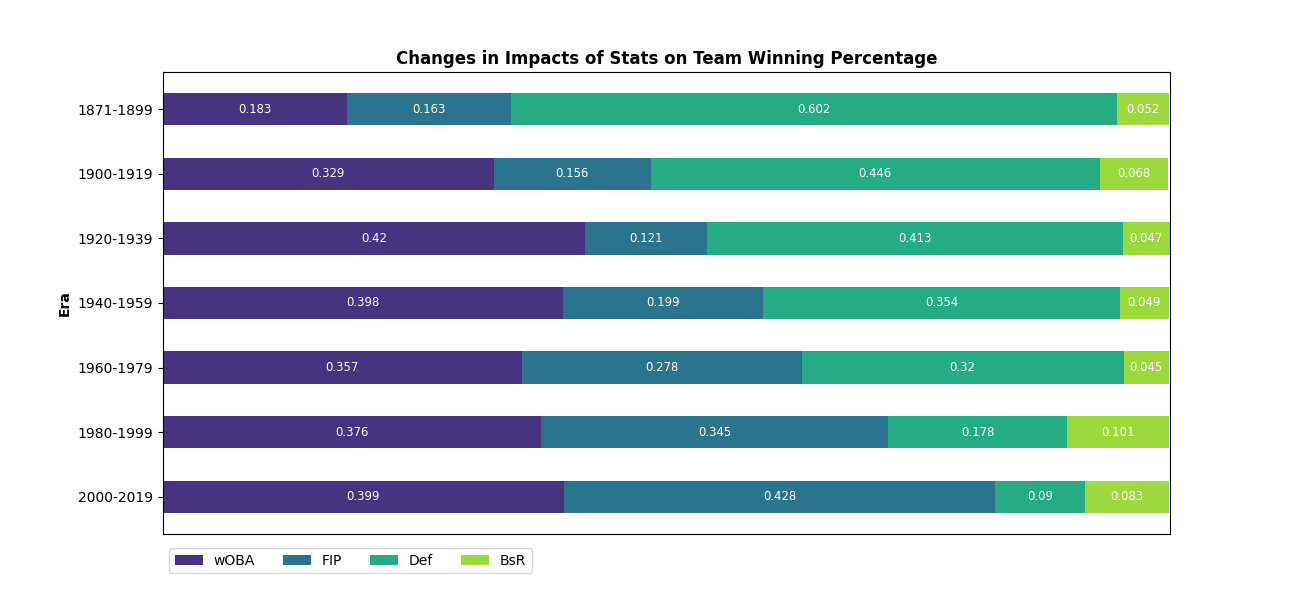 In the early days (1871 ~ 1899), fielding had the most significant impacts on a team's winning percentage (about 60.2%), while hitting, pitching and baserunning had marginal influences.
However, it appears that such a result has been reversed over time. The importance of fielding has declined throughout the history, whereas the importance of hitting and pitching has increased (especially, the constant increase in the importance of pitching is impressive).
Most recently, hitting and pitching account for the majority part of a team's winning percentage (about 80% together), while fielding and baserunning don't.
Furthermore, there's another noticeable pattern here. Baserunning has never been as important as hitting, pitching, and fielding since the start of MLB. In other words, teams have never benefited that much from successful base running in the MLB history, so why would teams want to focus on base running?
Bottom line: Hitting and pitching are equally important over the course of a season, while fielding and baserunning may not be.
4. Conclusion
In this column, I analyzed how important each aspect of player skills is in terms of a team's winning percentage. The four main areas are: hitting, pitching, fielding and baserunning, and these skills are measured by wOBA, FIP, Def and BsR, respectively. Of course, single stat is not enough to perfectly evaluate each areas of player abilities. Nevertheless, as this project aims to understand the impacts of pure skills, I decided to use a single stat for each aspect of skills to avoid overestimation problems. Through my analysis, I came to a conclusion that fielding used to be the most significant factor for teams in the early days, but such a trend seems to have changed over time. Since the 1900s, hitting and pitching started to account for large proportions of team winning percentages, while fielding is getting less important than it used to be. On the other hand, baserunning has never influenced a team's winning percentage that much. So it appears that teams would benefit from strengthening their hitting and pitching capacities. Nonetheless, this analysis also has several drawbacks. First, the impurity-based method for measuring feature importance tend to overestimate numerical features. Thus, the percentage contributions of each stat might have been overestimated. Second, since I did not use post-season data, the result may be inappropriate to conclude how much importance those stats have for post-season results. Therefore, further analysis would be required to see what makes the World Series champions, which is the ultimate goal of all MLB teams. In conclusion, it's very hard to say exactly how many proportions of team winning percentages are explained by each aspect of player skills. As I mentioned earlier, baseball is a complicated sport where many external factors affect the ball game like money, weather, or luck. Thus, even if we can build a model with single stats that perfectly evaluate each aspect of player skills, such a model would still have some degree of limitations (how would you measure and say what proportions of a team's winning percentage can be explained by the luck?). However, I hope this column has given readers some general ideas about what the importance of different aspects of player skills is and how it has changed over time.
5. References
Baseball Reference (2006). Lively ball era. Retrieved from https://www.baseball-reference.com/bullpen/Lively_ball_era