OPS vs wOBA,
Which one is a better hitting statistic?
1. Referred Article
Prospectus Feature: OPS and wOBA, Briefly Revisited (Baseball Prospectus, 2018)
2. Summary
An easy way for baseball fans to predict a team’s runs scored (RS) would be to look at On-Base-Plus-Slugging (OPS), the sum of OBP and SLG. However, despite its simplicity in terms of calculation, OPS contains fundamental drawbacks itself. Intuitively, it makes no sense to simply combine a rate statistic, OBP (i.e. represented as percentages), and weighted statistic that is not presented as percentages, SLG. Thus, the resulting stat, which is called OPS, is mathematically wrong. Furthermore, the weights assigned to each batting event involved in SLG (e.g 2 for doubles, 3 for triples etc.) has also proved to be overrated by computer simulations. To refine such drawbacks to OPS, Tom Tango, a sabermetrician, has devised an ultimate measurement of batting performance, wOBA. Since the invention of wOBA, it has been considered the single best measurement for batters’ hitting ability, as it properly weighs all the different hitting events and adjusts other external factors that affect hitting performance like Park Factor. Therefore, it is no wonder that sabermetricians and fans consider wOBA superior to OPS in terms of a team’s run production. Nevertheless, in July 2013, Cyril Morong, an economics professor at San Antonio College, found that the correlation between team OPS and RS is higher than the correlation between team wOBA and RS. Such a result seemed to reverse current beliefs about the accuracy of wOBA and to threat its overwhelming status as a single best batting performance measurement. Which is a better statistic?
3. Analysis
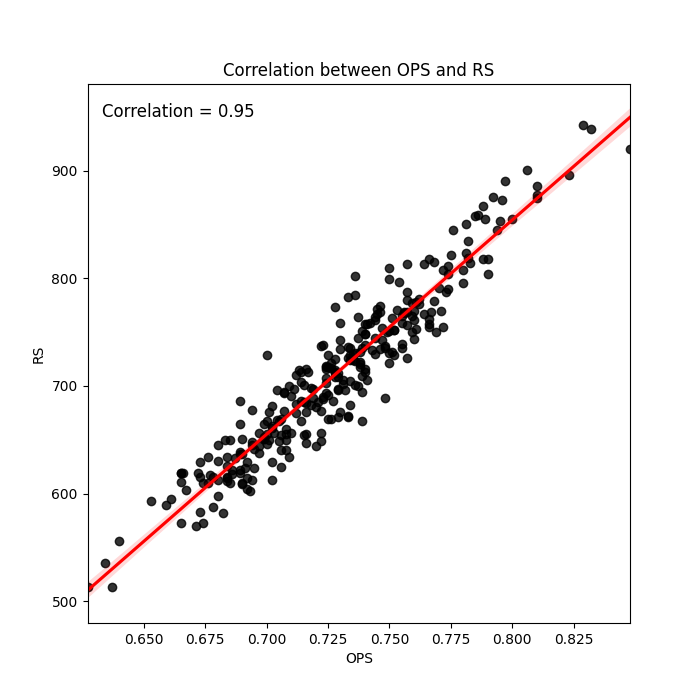
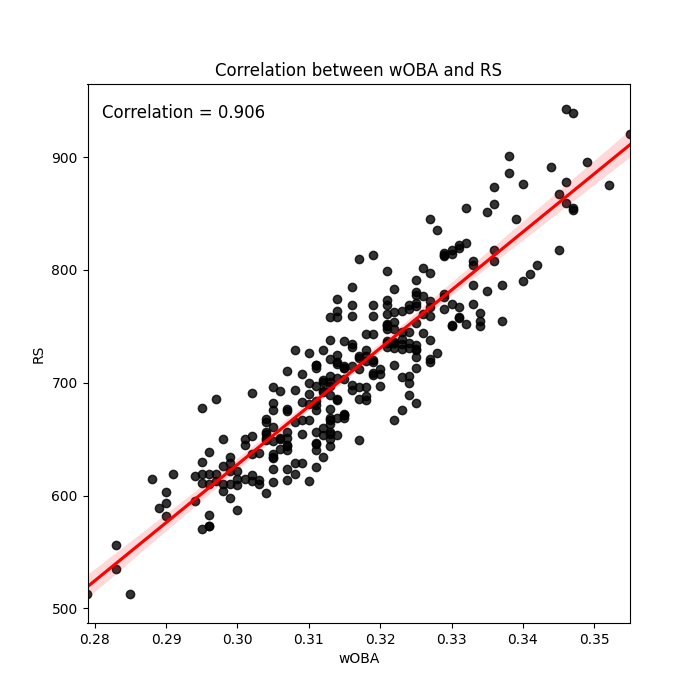
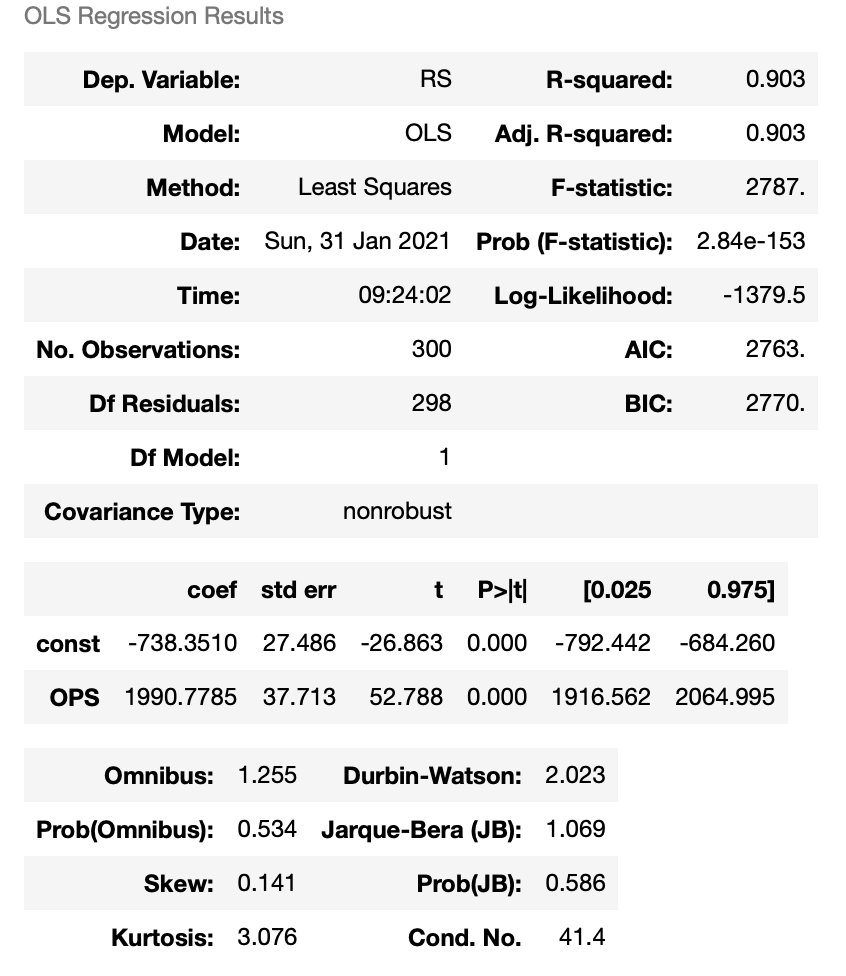
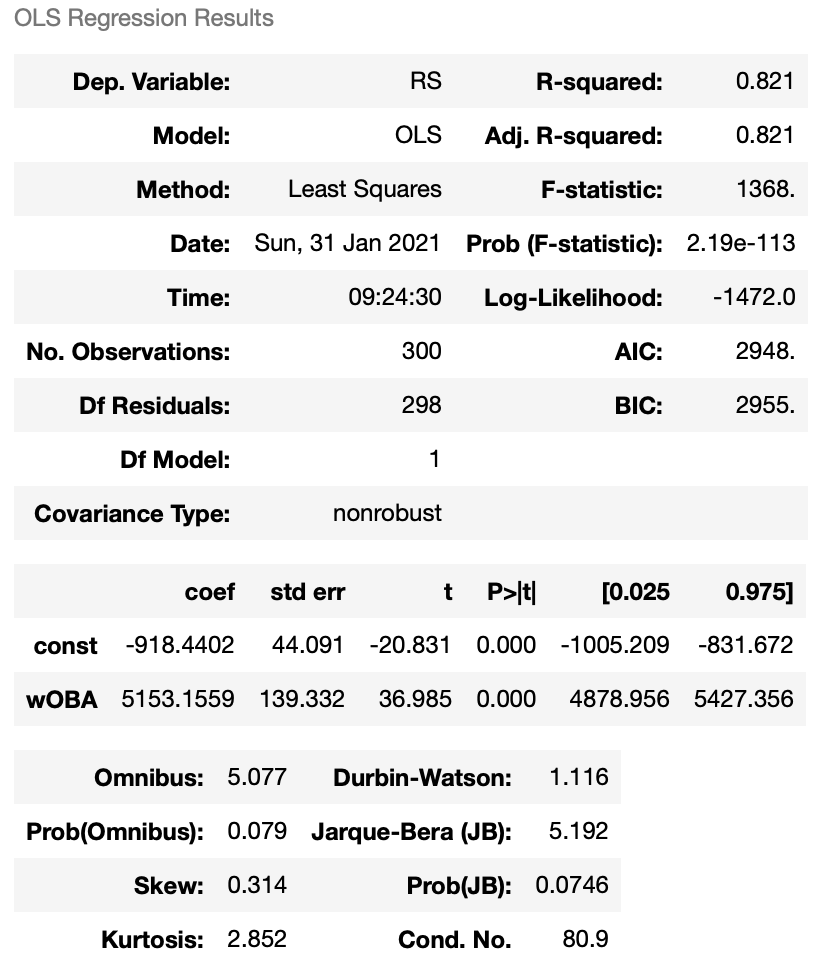
I have conducted two linear regression models in Python and have compared the results of those two models (Note: seasonal team batting data from 2010 and 2019 obtained from FanGraphs.com were used in both models). In the first model, the independent variable is team OPS, while the dependent variable is team runs scored (RS). The correlation between team OPS and RS is about 0.950 and this model yielded an R-squared of 0.903. Whereas I also selected team wOBA as an independent variable and team RS as a dependent variable in the second model. The correlation between these two stats is approximately 0.906 and the second model yielded an R-squared of 0.821 (see 5. Appendix). Unlike the common beliefs about the superiority of wOBA to OPS, according to those two regression models, OPS is more correlated with teams’ run production. Of course, the correlation does not necessarily indicate causal relationships between different factors. Nonetheless, OPS somehow seems to do better in predicting teams’ runs scored given those numbers. Then how should we explain the computational drawbacks to OPS? To explain such a weird result, let’s briefly have a look at formulas for both OPS and wOBA. (see 4. formula below ). In the OPS formula, the first component is OBP and the second part of the equation represents SLG. Disregarding (or admitting) the computational flaws in OPS (i.e. inaccurate weights for each hitting event and two different denominators that is summed), let’s focus on the hitting events that compose OPS. In the numerator, OPS includes 1B, 2B, 3B, BB (UIBB + IBB), HBP, and HR as tools for offense. What about wOBA? It includes NIBB (non-intentional BB, equvalently UIBB), HBP, 1B, 2B, 3B, and HR. That’s it. As astute readers might have noticed, wOBA excludes IBB (intentional BB) as a tool for offense unlike OPS does. The reason is simple. wOBA is devised to accurately measure individual batters’ contribution to teams’ runs scored. Therefore, Tom Tango would have had to rule out hitting events that do not represent batters’ pure hitting ability. I agree with this idea to the extent that I view wOBA as an ultimate measure of batters’ hitting ability. Nevertheless, baseball is a sport. In other words, there are also other external factors that contribute to teams’ run production (e.g luck, health, temperature, etc.). Thus, the pure hitting ability of batters for driving and scoring runs is not the only factors that produce runs. The intentional BB (excluded from the wOBA calculation, but not from OPS. Thanks to OPS!), forces batters at the plate to reach first, which indeed increases the probability of scoring runs. IBB also indicates the greatness of hitters in a way. Otherwise, why do pitchers intend to avoid throwing pitches at those who get IBBs? No matter whether it is far from batters’ hitting ability or not, it is a factor that should still be considered when predicting teams’ runs scored. I believe that this is what makes the correlation between team OPS and RS higher than the correlation between team wOBA and RS (i.e. whether intended or not, OPS considers factors ruled out from wOBA that it should not be when predicting teams’ runs scored). Bottom line: Without a doubt, we cannot deny that there are fundamental computational flaws in OPS calculation, and thus, OPS makes it difficult to accurately measure individual players’ actual contribution to teams’ run production. Therefore, it is more reasonable to rely on wOBA when evaluating individual players’ hitting abilities. However, since baseball is a sport consisting of both measurable and unmeasurable factors, I daresay we also need to keep an eye on stats that contain (or represent) unmeasurable factors.
4. Formula
5. Appendix
6. References
Baseball Prospectus (2018). Prospectus Feature: OPS and wOBA, Briefly Revisited. Retrieved from https://www.baseballprospectus.com/news/article/41203/prospectus-feature-ops-and-woba-briefly-revisited/ FANGRAPHS (2010). OPS and OPS+. Retrieved from https://library.fangraphs.com/offense/ops/ FANGRAPHS (2010). wOBA. Retrieved from https://library.fangraphs.com/offense/woba/